What is Centuries of Chess?
Centuries of Chess is an interactive way of visualising the vast amount of chess games that have been played throughout history. The moves you make on the board will be matched against a database of previously recorded games (currently, over 2.1 million), the website allows you to explore how you play, in comparison to those who played in the past. There are three different ways of looking back at past games:
Move Explorer
The purpose of this tool is to show the most popular following moves based off your current board position. It displays not only how likely the next move is to be played, but also the white/black winrate.
Statistics
The Statistics page shows general statistics of the current game played (such as white/black win rate, average elo for white/black). It gives insight into the level of gameplay for both sides, though the quality of data will degrade as fewer and fewer games exist to pull the data from.
Game Database
This panel shows a table of data on individual games with results being able to be sorted by things like earliest games or highest ranking elo. It provides the full list of moves for games that match the moves you make so you can follow the exact path of a game. This tab is most useful for looking at specific games, using the sorting filter to find interesting games.
Development and Design
Database Design and PGN Parser
From the earliest stages of development, I wanted more than just a database of previous games. I realised insight could be gained from looking at the statistics of the players and the outcomes for the games they play. Whilst researching publicly available game collections to use I stumbled upon the Lichess Elite Database, a collection of public games played on the Lichess website.
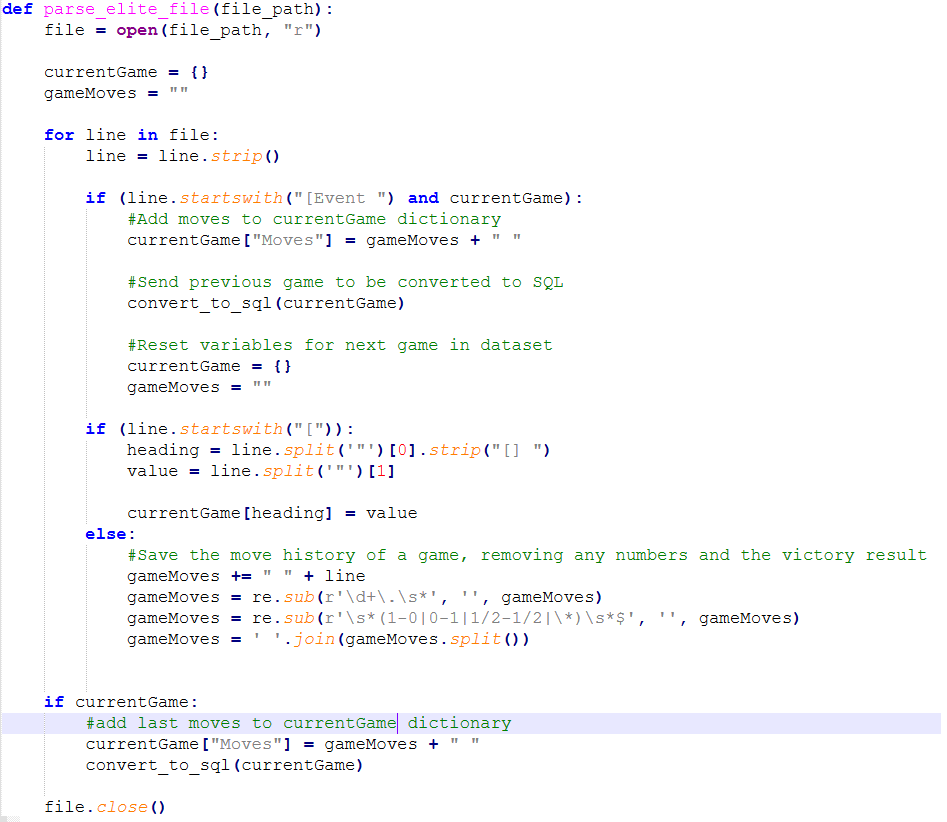
To extract only the data I felt was necessary for the database I wrote a custom Python script to parse the PGN files and transfer relevant data to the database. The parser could parse multiple files from running just once. The database currently contains over 2.1 million games to serve as a proof of concept. I hope to find more data sources to grow the collection of games (particularly older games).
Creating the game
To create the board and game pieces I made use of the chessboard.js library. I chose this library as it is a dedicated way of rendering the board without having to create all the chess elements. The only downside of using this library being that all logic needed to be added separately. To help with creating game logic I also used chess.js to manage game state and validate legal moves.
Because the two libraries handle two different responsibilities, I had to implement logic to integrate user interaction and the rules of chess. One example is adding a custom pawn promotion validator which checks to see if a pawn is in the final rank (depending on its colour) and then displays a menu to select which piece to promote to.
Extracting data from the table
Once I had a playable board and a database to match games filled with data the next step was to turn the stored games into useful information. Each tab shows information in a different way: the Move Explorer highlights trends in the decision making element of the game, the Statistics page finds average information about remaining games, and the Game Database allows you look more in-depth with specific games and their moves.
The first representation of data I completed was the game database, where I selected games which had moves LIKE the moves made on the website, the results could be sorted by a variety of different criteria such as the difference between players elo or the earliest game using SQL's ORDER BY parameter. Loading all games from the table which match would be impractical for early games where there are millions of results so I added a page navigation element below the table, limiting each page to a maximum of 20 results and allowing for the SQL query to LIMIT the selection to 21 results (with the 21st result indicating the need for another page of results).
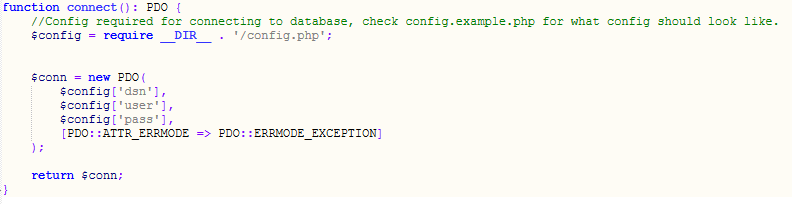
The next tab I worked on was the Statistics tab, which I improved by separating the database connection script so it can be used for multiple requests, instead of repeating code. The statistics data was fairly simple to SELECT, mainly being count()'s of rows and then calculating averages based on those results.
The final tab to be completed was the Move Explorer, which shows the most common next move made by the remaining players in the games that match the board. I found the next move by counting the number of moves have been made and finding the moves made after the most recently played move. It shows how most players make similar moves even when in unfamiliar situations.
HTML, CSS and JavaScript
The HTML section of this project was relatively simple, this project did however teach me how to interact with a html page using JavaScript, where the tables are dynamically populated once the data gets pulled.
As a computer science student, I first found the visual design of the website to be a challenge. I wanted to create a 'split screen' effect for the site, keeping the board accessible even when switching between different representations of the data. I developed my understanding of styling and layout by referring to the MDN Web Docs to build and change to match the desired aesthetic.
A majority of the work done on this project was with the JavaScript portion of the project. The JavaScript code covers the actual chess gameplay, the tab switching, each database request and the rendering of the recieved data. It involved state management, only making a database call when a tab is loaded with a 'stale' game and acts as the glue which connects each piece of the site.
Move Explorer:
The Move Explorer shows the data for the next possible move, with what percentage of games make each move next and how that affects the win rate for either sides. Click any of the results in the next move tab to make the move on the board.
| Next Move | Number of Games | Win Count | % of Remaining Games |
|---|
Statistics
This panel shows information about all remaining games, giving insight into how a game evolves over time as more moves are made. It is worth noting that these are averages over all remaining games, so as the number of games falls the data will be less accurate.
| Year | Names | Elo | Move Count | Moves | Result |
|---|